You wire up an HTTP Request node, point it at an API, hit execute, and instead of the clean { "temperature": 28.4 } you were expecting, the output panel fills with <!DOCTYPE html> and a pile of tags. No red border on the node. No error banner. It ran. It just handed you a web page instead of data, and now every node downstream that expects orderStatus or price is going to choke on something that isn't there.
This is one of the most common things that goes wrong with the HTTP Request node, and it's also one of the least explained — the node doesn't tell you why it got HTML, it just gives you what it got.
This is the one I get asked about most. And the reason it trips people up is that nothing looks broken — there's no error to go and search for. The node is green. So people re-read the URL for the fourth time, start wondering whether they typed something wrong, and eventually start suspecting n8n itself.
Almost everyone I've walked through this does the same thing first: pastes the URL into a browser tab, watches it return perfect JSON, and comes away more confused than before. Which is fair — but that browser test is actually the most useful clue you have, and it's pointing straight at the answer. We'll come back to it.
If this is your screen right now, you're in the right place:
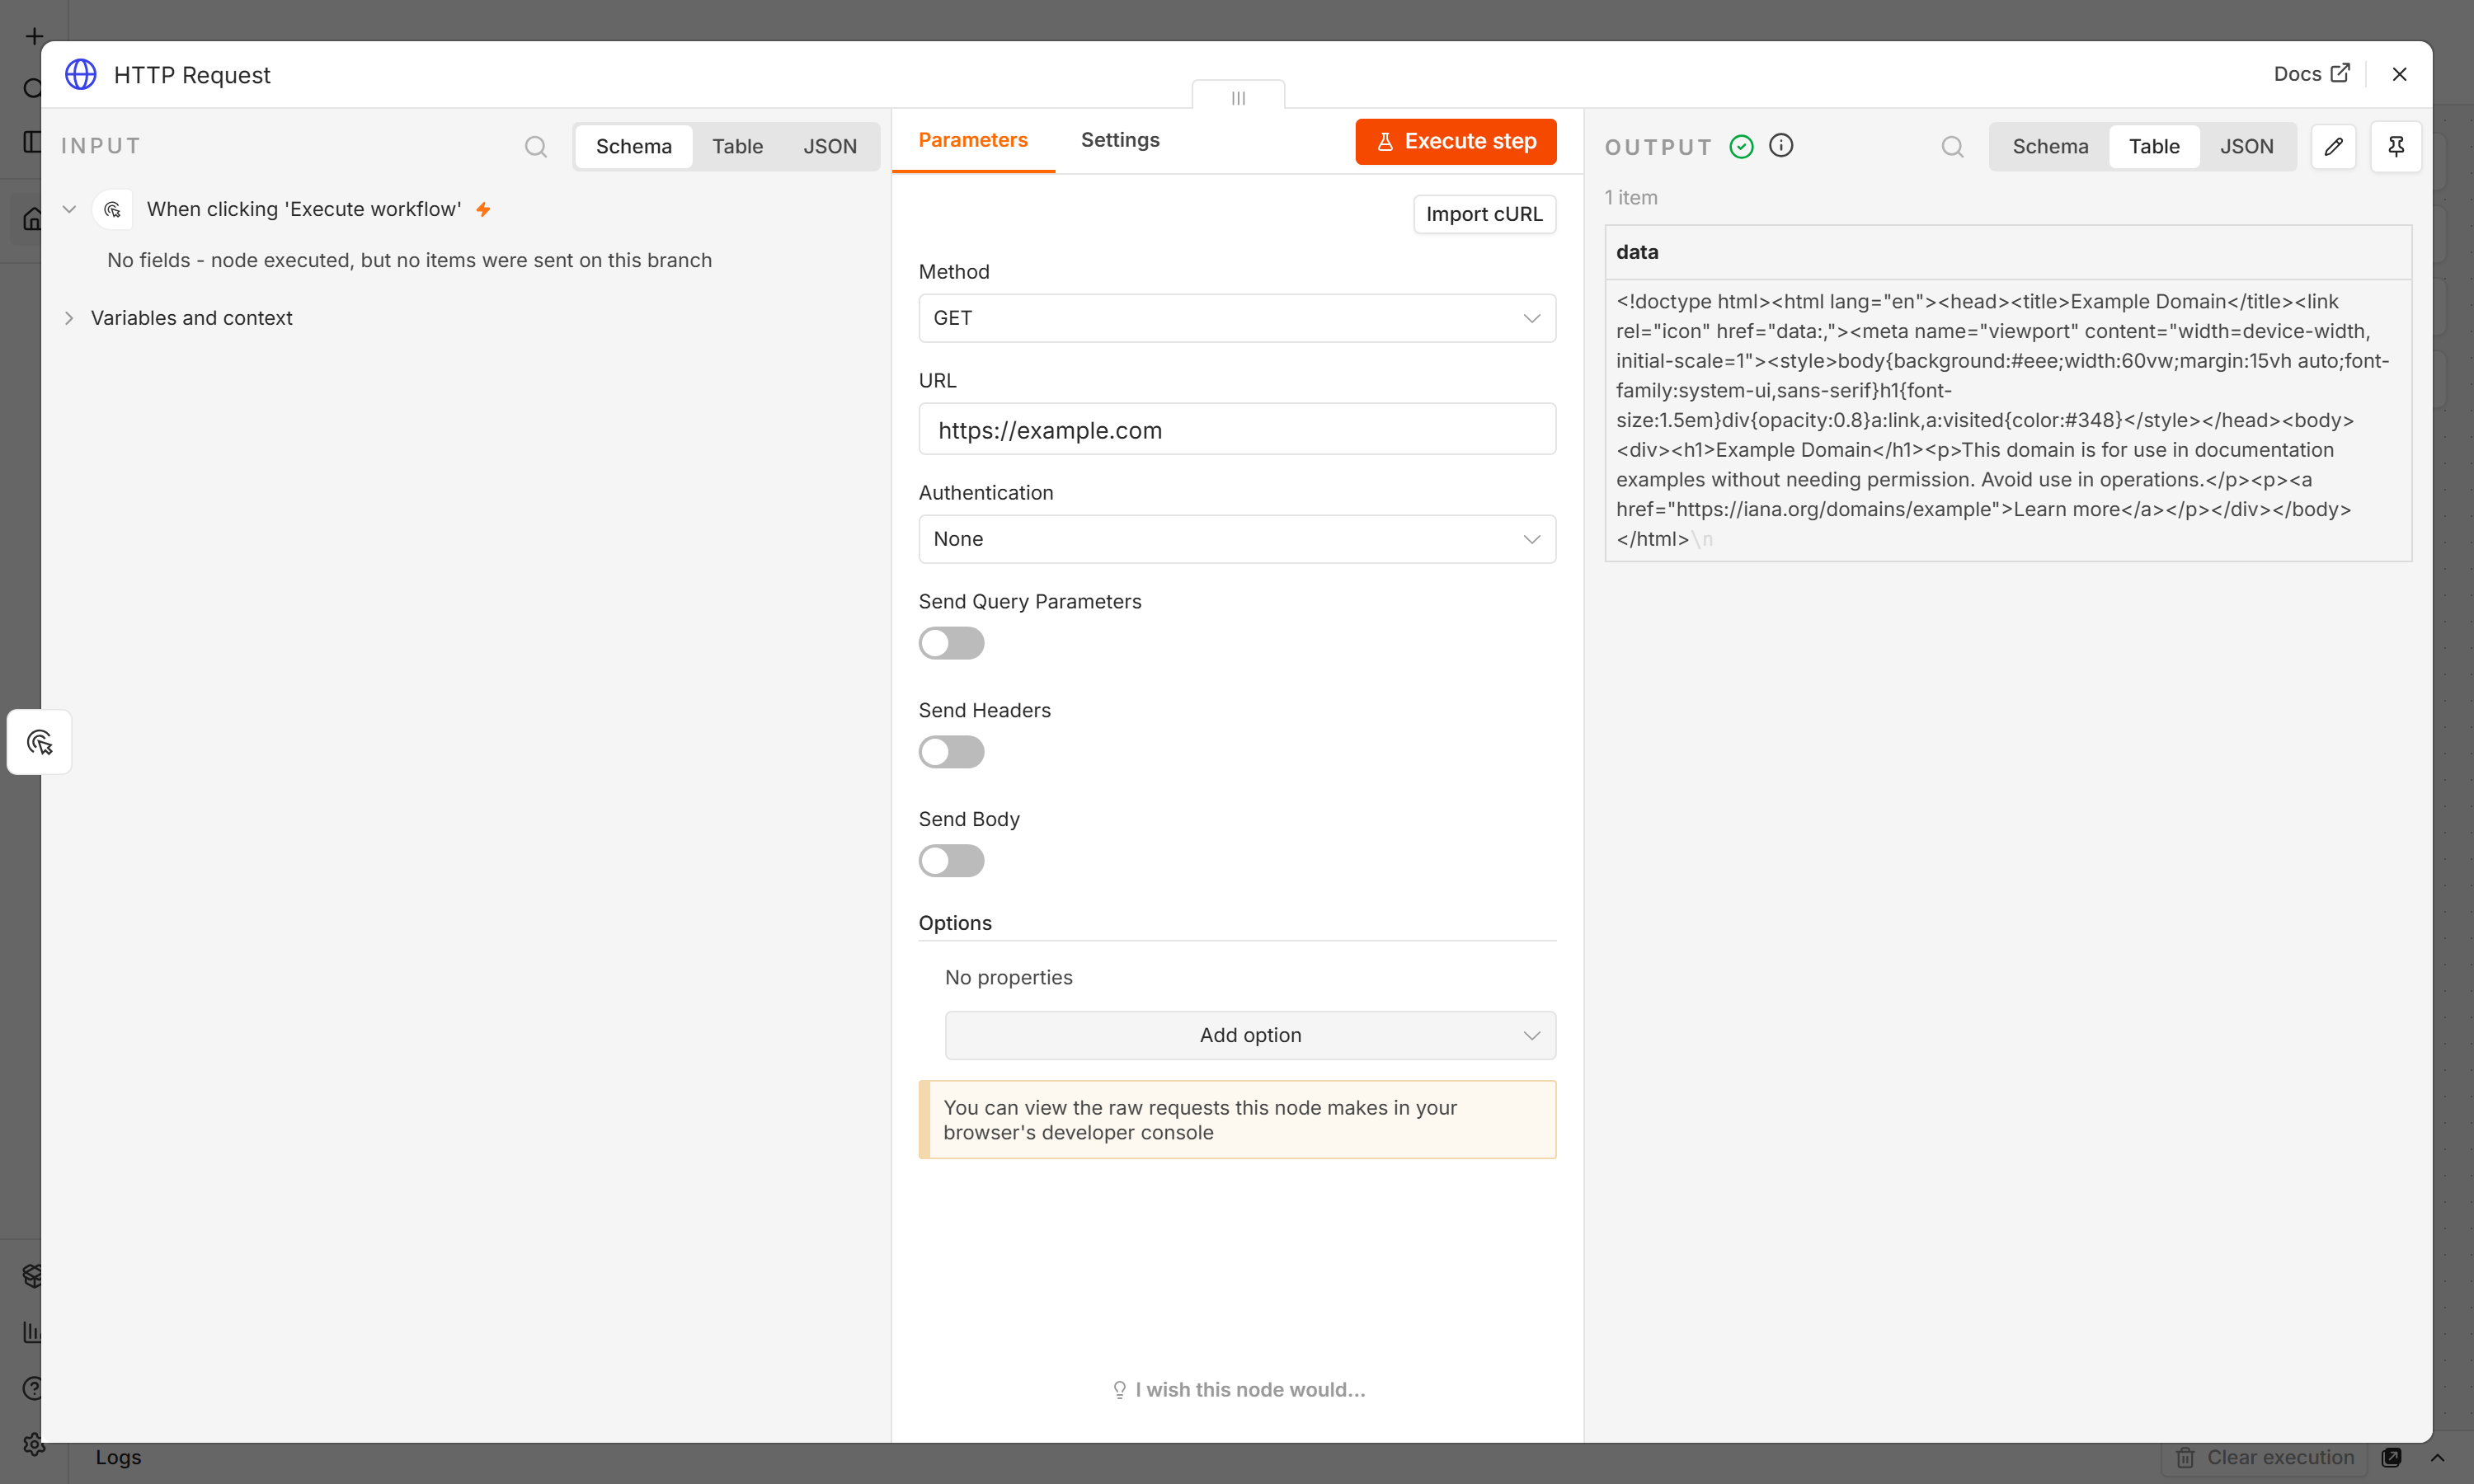
Look closely at what n8n is telling you there, because it matters: there's a green tick on the output. The node thinks it did its job. It asked for a thing, it got a thing back, it handed you the thing. Nobody told it the thing was supposed to be JSON.
So let's actually work through it: what's really happening when this shows up, and which of the four real causes yours is.
New to the HTTP Request node? The mechanics — the trigger, the node, the Execute step — are covered from scratch in the first workflow tutorial. This post assumes you've already got a request going, and it's the response that's wrong.
What's actually happening
An API is supposed to answer you with JSON — structured data, the kind n8n can pick fields out of. HTML is what a website sends a browser, meant to be rendered with a layout and styling, not read by a workflow. When your HTTP Request node gets HTML back, it means whatever answered you on the other end wasn't the API endpoint you thought it was talking to — it was a web page. Usually one of four specific things, and each one leaves a slightly different fingerprint if you know where to look.
The scenario: pulling a private API that suddenly stops behaving
Say you're pulling order data from a SaaS platform's REST API — something like https://api.example.com/v1/orders — into a workflow that's worked before, or that you copied from a tutorial and pointed at your own account. You run it, and where you expected a JSON array of orders, the output panel shows a full HTML document, maybe with a <title>Sign In</title> tag near the top if you scroll far enough. That's the exact shape this post walks through, and every fix below applies whether you're hitting this API or a different one — the diagnosis process is the same.
Cause 1: you're not actually authenticated, and the API is showing you its login page
This is the most common one, and it's also the most misleading, because the request runs. No 401 in red, no obvious failure. What happens is the API checks your credentials, finds them missing or expired, and — instead of returning a proper 401 Unauthorized JSON error — redirects you to a login page, and that login page is what n8n receives and shows you as the response.
And this is why the browser test fools everyone. When you paste that URL into your own browser, you're already logged in — your session cookie rides along automatically and the API happily answers. n8n has no cookie, no session, nothing. It arrives as a complete stranger. Same URL, two entirely different requests. So "but it works in my browser" isn't evidence the API is fine — it's usually the strongest sign that the problem is authentication.
How to confirm it's this one: open the node's Options panel and turn on Include Response Headers and Status — by default the node only returns the body, so you can't see the status code it actually got. Run it again and check the status. A 200 with HTML that mentions "sign in" or "log in" anywhere in it is this exact problem — the request technically succeeded, it just succeeded at loading a login screen, not your data.
Some APIs are better behaved and tell you outright. Here's the same node pointed at an endpoint that returns a proper 401 instead of a login page:
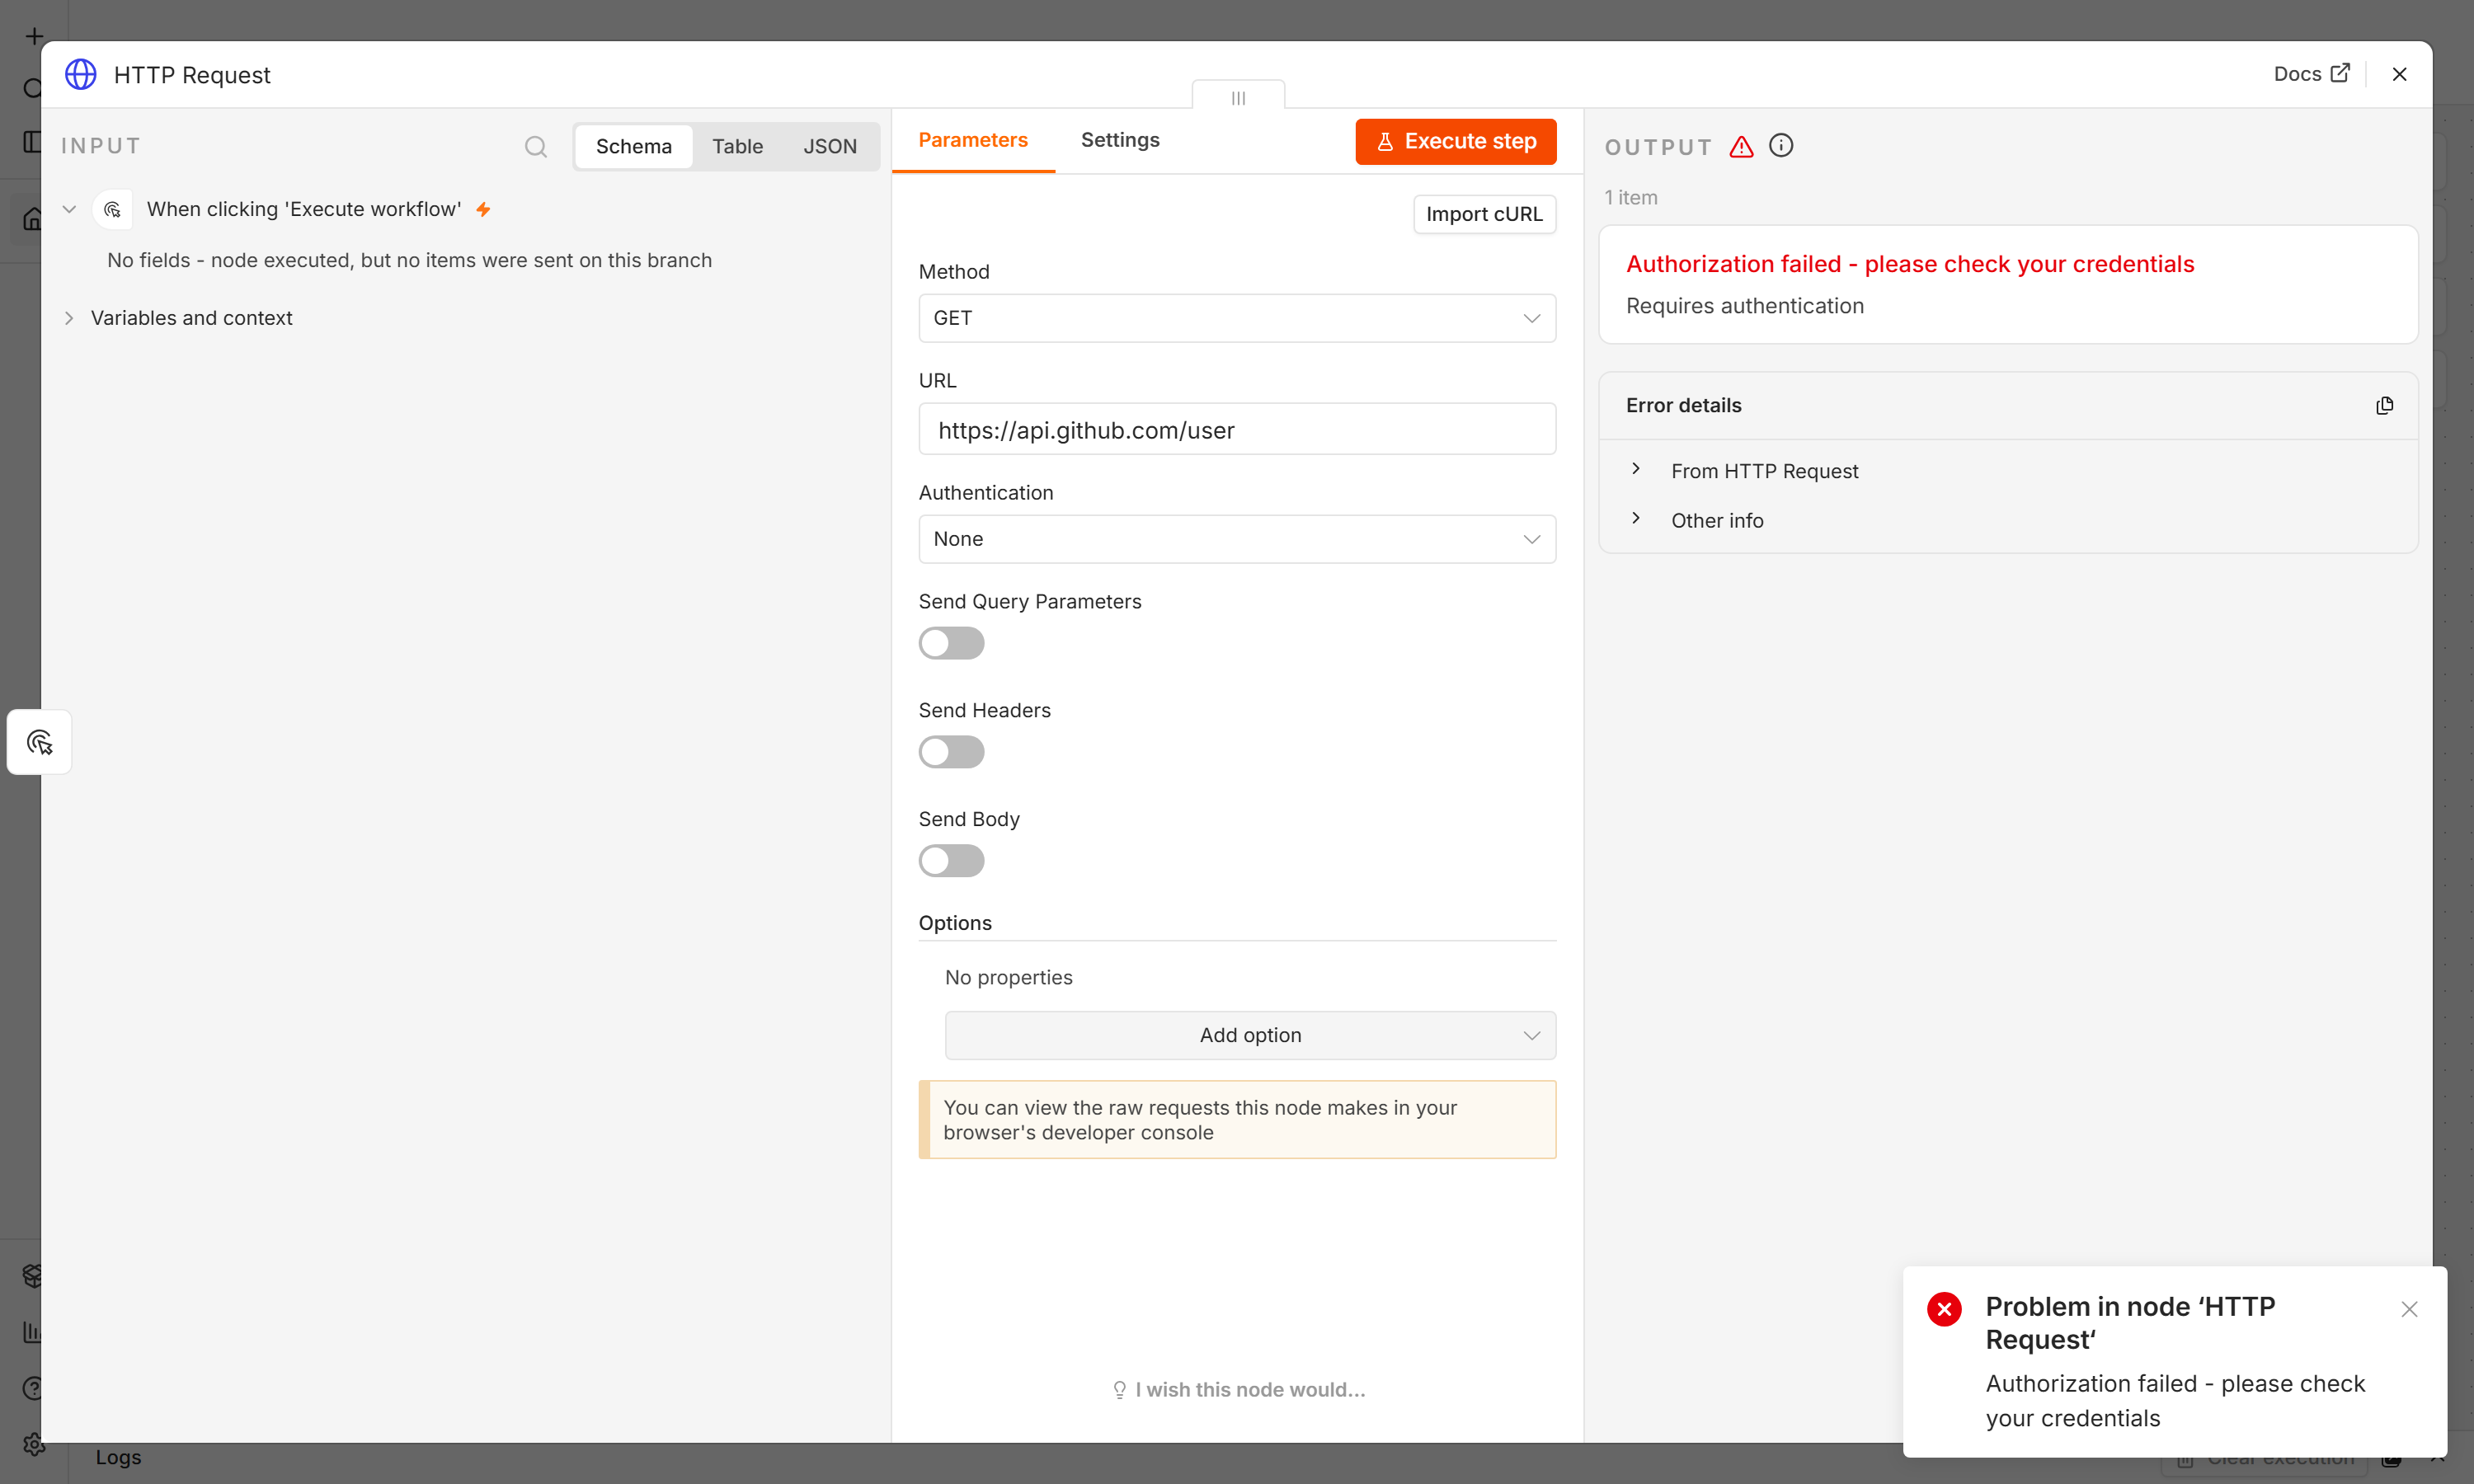
That red banner is the good outcome. It's the same underlying problem — you aren't authenticated — but this API said so plainly instead of handing you a web page. If you're getting HTML rather than this, your API is simply less polite about it.
The fix: check the credential attached to the node — is it actually selected, and is the token still valid? A lot of APIs expire tokens silently; the credential still exists in n8n, it's just not accepted anymore. If you're using a Bearer token or API key manually in a header rather than n8n's credential system, that's worth double-checking too — a token that's a day expired looks identical to a correctly-typed one until you actually run the request.
Cause 2: a redirect is quietly sending you somewhere else
Related to the above but distinct enough to check separately: some APIs don't show you a login page directly, they issue an HTTP redirect (a 301 or 302 status) to a different URL — often an auth or login domain — and n8n follows it automatically, because Follow Redirects is turned on by default in the node's Options. You end up looking at whatever's at the end of that redirect chain, not the endpoint you typed in.
How to confirm it's this one: in the same Options panel, temporarily switch Follow Redirects off and run the request again. If you now get a 301 or 302 status back instead of a 200, you've found it — the node is telling you it was redirected, and the Location field in the response headers shows exactly where to.
The caveat here, concretely: if that redirect crosses domains — say api.example.com redirecting to auth.example.com — some APIs and n8n's own redirect handling will drop your Authorization header for the hop, on purpose, as a security measure. So even if you re-enable redirects and add the right token, it can still fail silently on the second leg. The more reliable fix is finding the actual final URL (the one after the redirect) and calling that directly, headers and all, rather than relying on the node to follow the chain for you.
Cause 3: the API wants to know you're asking for JSON, and you never told it
Some APIs serve different formats depending on what you ask for — this is called content negotiation, and it happens through the Accept header. Skip that header entirely, or send a generic one, and a handful of frameworks (especially ones that also serve a web frontend from the same backend) default to handing back their HTML page instead of the JSON API response, because as far as the server's concerned, you didn't specify that you wanted the machine-readable version.
How to confirm it's this one: this is the one that won't show up in the status code — you'll likely see a clean 200, just with HTML in the body, no redirect, no auth complaint. If Cause 1 and Cause 2 both check out clean and you're still getting HTML, this is next.
The fix: in the node, open Send Headers, choose Using Fields Below, and add a header with name Accept and value application/json. That one line tells the server explicitly: I want the data format, not the page. It's a small thing to add and it's worth including by default on any API you're integrating with for the first time, rather than waiting to hit this.
Cause 4: there was never an API there — you're pointed at a web page
Sometimes the simplest explanation is the right one: the URL in the node is a page meant for a browser, not an API endpoint at all. This happens more than you'd think when you're copying a URL from your browser's address bar while looking at a dashboard, rather than from actual API documentation — the page you're looking at renders its data through JavaScript calls you can't see just by reading the address bar, and the URL itself just serves the HTML shell.
How to confirm it's this one: open that same URL directly in a browser and look at what loads. If it's a normal web page with a layout, navigation, styling — that's your answer, and no header or credential fix will change what that URL sends back, because it was never designed to answer machines. What you actually want is the specific API endpoint the page's JavaScript is calling behind the scenes, which you can usually find in your browser's Network tab (see how to check network requests in Chrome DevTools if you haven't done this before) — filter to XHR/Fetch requests, reload the page, and look for the call that returns JSON. That's the URL that belongs in your HTTP Request node.
One close cousin of this, worth a mention: if the response HTML contains a challenge phrase like "Just a moment" or "Checking your browser," or the response headers include a cf-ray value, that's Cloudflare's bot-protection layer stepping in front of the site — not the site itself. A workflow node isn't a browser and doesn't clear that challenge, so the fix isn't a header tweak, it's finding whether the service offers an official API with its own authentication, rather than scraping the page a browser would see.
It's possible you actually got JSON — and the table view is lying to you
Before you go further down any of the four causes above, rule this one out first, because it takes ten seconds: click the node and check whether the response is actually landing in the JSON or Schema view rather than assuming it from Table view. If the response has an unusual shape — nested deeply, or the top-level thing is a string rather than an object — Table view can render it strangely enough that it looks wrong even when the data underneath is genuinely valid JSON. Switch views before you go hunting for a cause that isn't there.
Separately, check the node's Options → Response → Response Format setting itself. It defaults to Autodetect, which usually gets this right, but if it's been explicitly set to Text, the node will show you the raw response as a plain string even when the underlying data was JSON — and a raw JSON string dumped into Text mode can look enough like a wall of text that it's easy to mistake for the HTML problem you were expecting. Switching it back to Autodetect or explicitly to JSON clears this up immediately.
For comparison, this is what a healthy response looks like in the same panel — named fields you can actually pick from, instead of one data field with a document crammed into it:
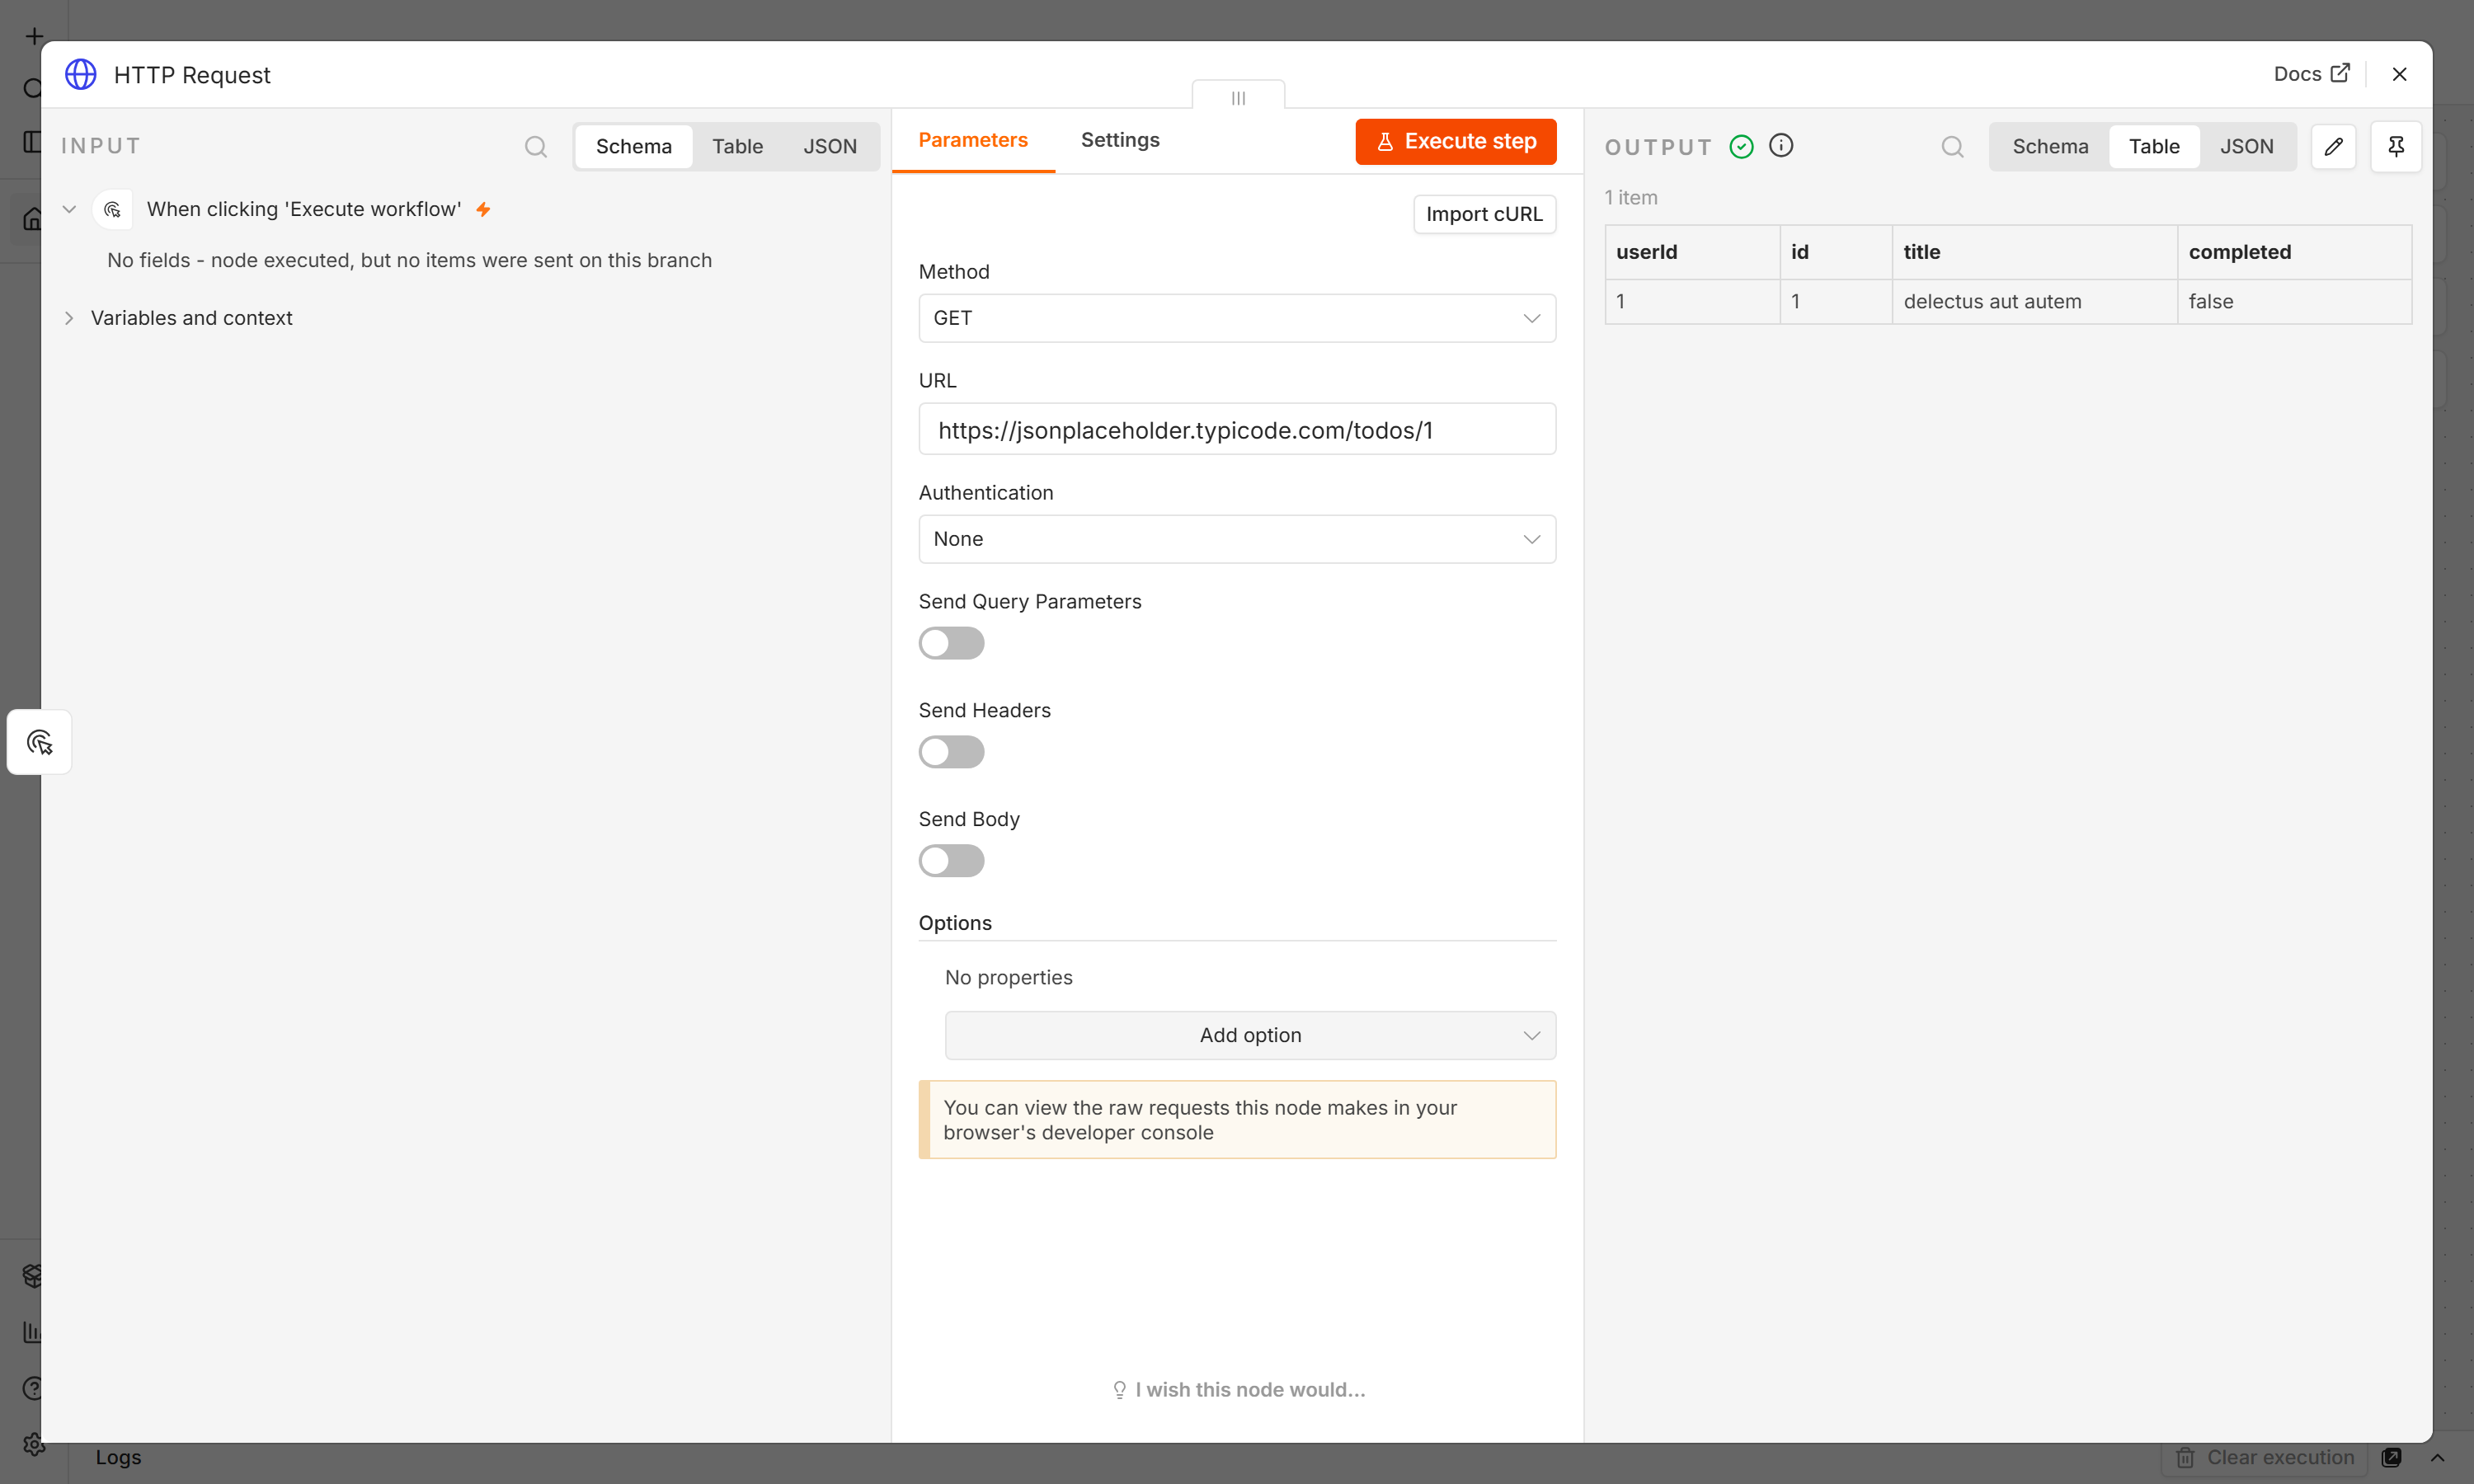
That's the shape you're aiming for. If your output has one field holding everything, you've got one of the four problems above. If it has named fields, you're already done and the rest of your workflow can start reading them.
Where to take it
Add the
Accept: application/jsonheader by default on any new HTTP Request node you build against an unfamiliar API — it costs nothing and rules out Cause 3 before it ever happens.Turn on Include Response Headers and Status while you're building, then turn it back off once the workflow's confirmed working — it's the single fastest way to see the real status code instead of guessing from the body.
If you're hitting the same private API regularly, see connecting n8n to real APIs and live data for the fuller picture — query parameters, nested JSON, pagination, and the other ways a "working" API call still needs care.
If the field you need is buried in a nested object even after you've confirmed the response is genuine JSON, that's a separate but related problem covered in the same guide above, under how n8n's Schema view surfaces nested fields.
Newer to n8n than this post assumes? The complete beginner's guide walks the whole toolset from nothing — nodes, triggers, items, expressions, credentials — and links out to the free 24-video course. This error makes a lot more sense once the vocabulary does.
Get the next one
If this is the second or third time you've hit a "the run went green but the data's wrong" problem in n8n, that's exactly the pattern I keep digging into — the failure modes that don't throw an error, because those are the ones that actually cost you time. Subscribe and the next one lands with the gotcha already flagged.
For the full map of every n8n guide on the site, in order, the n8n hub has all of them.
FAQ
Why does my HTTP Request node show a 200 status but the body is HTML instead of JSON?
A 200 status only means the server answered successfully — it doesn't mean it answered with what you asked for. The most common reason is that the server redirected you to a login page and that page loaded fine (hence 200), or the server defaulted to its HTML frontend because you didn't send an Accept: application/json header. Turn on Include Response Headers and Status in the node's Options to see the full picture, not just the body.
How do I check what status code and headers an n8n HTTP Request actually got?
Open the node's Options panel and enable Include Response Headers and Status. By default the node only returns the response body, which hides exactly the information you need to diagnose an HTML-instead-of-JSON problem — the actual status code, any redirect location, and response headers like cf-ray that point to Cloudflare's bot protection.
I added credentials and it's still returning HTML — what am I missing?
Two things worth checking in order: first, whether the credential is expired rather than missing — an expired token behaves identically to a correctly filled-in one until the request actually runs. Second, whether a cross-domain redirect is dropping your Authorization header partway through — turn off Follow Redirects temporarily and check whether you get a 301 or 302 back before you get to any HTML at all.
Does adding an Accept header actually change what an API sends back?
For APIs that use content negotiation, yes — the Accept header is literally how you tell the server which format you want when it's capable of serving more than one. Add a header named Accept with the value application/json under Send Headers → Using Fields Below. It won't fix an authentication or redirect problem, but it directly fixes the case where the server was defaulting to HTML because you never specified otherwise.
How do I know if a site is blocking me with Cloudflare instead of just failing normally?
Look at the HTML you got back for a phrase like "Just a moment" or "Checking your browser," or check the response headers (with Include Response Headers and Status turned on) for a cf-ray value. Either one means Cloudflare's bot-protection layer answered you, not the actual site — no header or credential change in the HTTP Request node clears that challenge, because it's designed to stop exactly this kind of automated request.
What's the difference between this and a workflow that just returns an empty result?
An empty result usually means the request succeeded and the API genuinely had nothing to send back for your query — a search with no matches, a date range with no records. HTML in the response body means the request effectively failed to reach the API you intended, even though nothing in the workflow reports it as a failure. The tell is in the content: empty is [] or {}; this problem looks like a full web page.
Can I make n8n automatically detect this and stop the workflow instead of continuing with bad data?
There's no built-in HTML-detection setting, but you can build the check yourself: add an IF node right after the HTTP Request node that tests whether the response is the shape you expect — for example, whether a field you know should exist is present — and route the false branch somewhere that flags it rather than letting bad data flow further downstream. That's the same true/false routing idea covered in the IF node tutorial, applied to catching this specific failure instead of a business rule.

